Super Bowl Wagers and Casino Site Visits: Uncovering Annual Patterns
Written by Willa Patterson · Oct 21, 2026
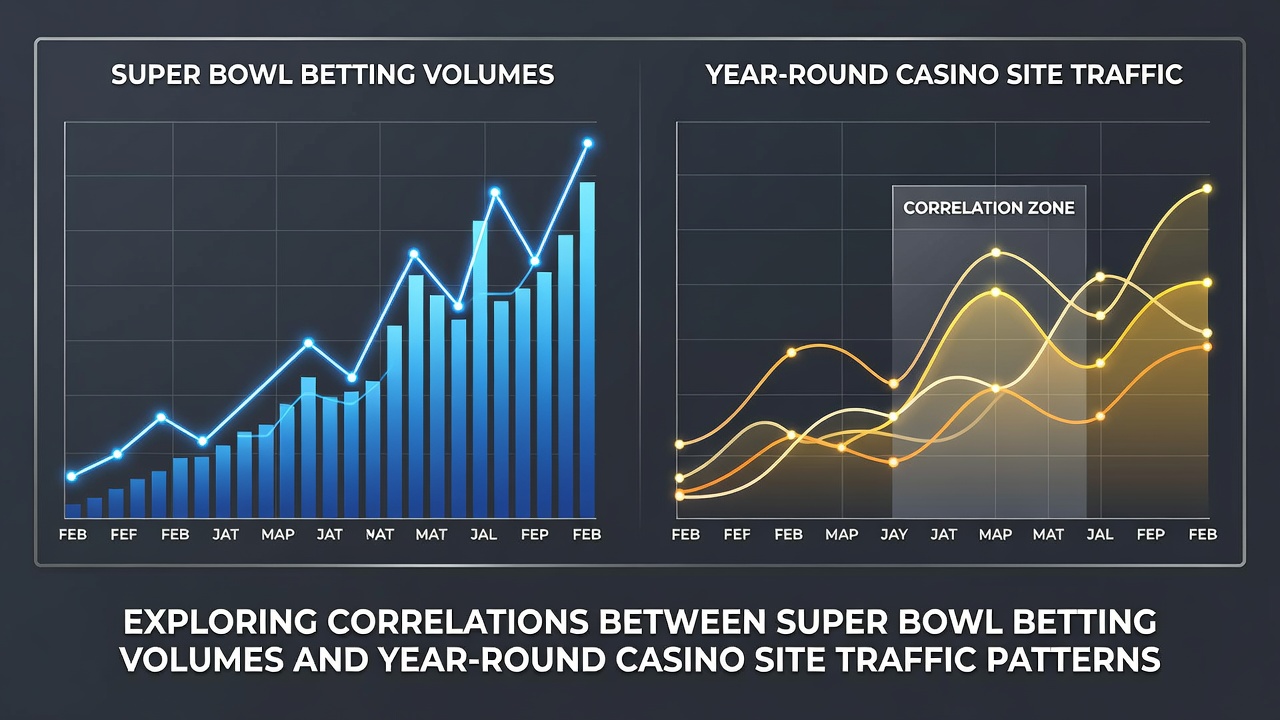
Super Bowl Wagers and Casino Site Visits: Uncovering Annual Patterns
Super Bowl betting volumes spike dramatically each February while researchers track how those surges connect to visitor numbers on casino sites across the remaining months, and data from multiple jurisdictions reveals consistent relationships that extend well beyond the event itself. Observers note that the single-game focus generates billions in wagers, yet the patterns that emerge afterward influence operator decisions year-round.
Tracking Betting Volume Spikes
Figures from state regulators show Super Bowl handle in the United States reached record levels in recent years, with Nevada alone reporting over $150 million in sports bets during the 2025 event; those numbers climbed further in subsequent seasons as mobile platforms expanded access. And because the game draws casual participants who rarely engage with sportsbooks otherwise, the influx introduces new accounts that operators then convert into regular users through targeted promotions that run for months afterward.
Traffic analytics firms record immediate jumps in casino site visits during Super Bowl week, often exceeding 40 percent above baseline averages, and those elevated levels persist into spring when operators release new game libraries or bonus structures timed to retain the audience. Researchers at academic institutions have mapped these movements across multiple seasons, finding that sites offering integrated sports and casino products retain a higher share of visitors compared with standalone platforms.
Year-Round Traffic Fluctuations
Casino websites experience predictable seasonal dips during summer months when outdoor activities compete for attention, yet operators who analyzed post-Super Bowl data discovered they could offset those declines by rolling out content tied to the earlier betting surge. Data collected through 2025 and into 2026 indicates that sites maintaining consistent promotional calendars tied to February events saw steadier traffic curves, with October 2026 reports highlighting renewed activity as football season resumed and cross-promotions reactivated dormant accounts.
Industry reports compiled by groups such as the American Gaming Association detail how mobile engagement metrics rise sharply after major sporting events, while desktop traffic remains more stable. Those patterns suggest that users introduced through Super Bowl betting often shift to casino play on the same devices, creating a measurable bridge between the two verticals that continues through the calendar year.
Measuring the Correlations
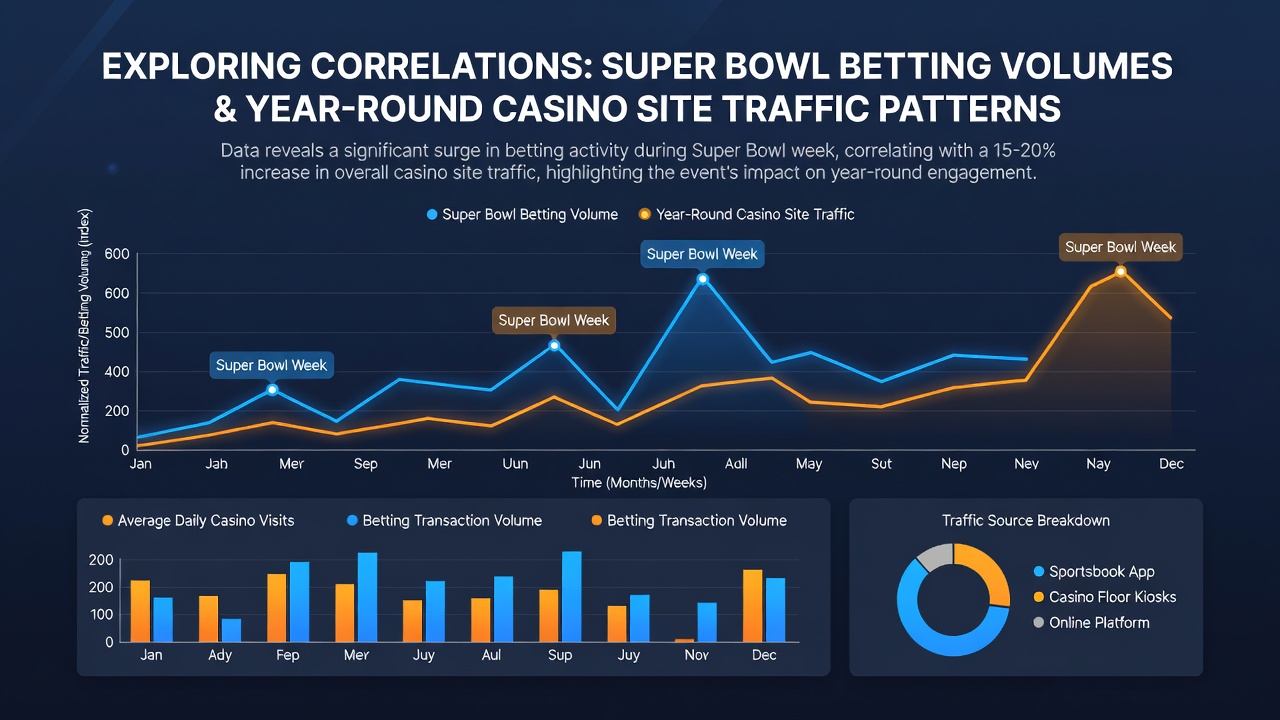
Statistical examinations conducted by data scientists reveal moderate to strong correlations between Super Bowl betting volumes and subsequent casino site traffic, particularly in jurisdictions where sports betting and iGaming operate under unified regulatory frameworks. Correlation coefficients calculated from multi-year datasets frequently range between 0.65 and 0.82, indicating that higher wagering participation predicts increased casino visits in the following quarters when other variables remain constant.
One analysis of Australian market data, drawn from reports issued by state-based regulators, showed similar linkages despite differing product offerings, and researchers there observed that promotional follow-ups after major events produced traffic gains that lasted into the third quarter. European operators have reported parallel outcomes, with traffic stabilization occurring after large-scale sporting events when loyalty programs activate quickly.
Regional Variations and Data Sources
Canadian provincial data adds another layer, where Ontario's regulated market demonstrates that integrated platforms experience less pronounced seasonal drops compared with markets that separate sports and casino products. Those findings align with observations from New Jersey regulators, who track account-level activity showing that users placing Super Bowl bets often return for table games or slots within 90 days. October 2026 figures from several jurisdictions underscore that these patterns held steady even as overall participation rates fluctuated due to economic factors.
Operators adjust staffing, server capacity, and marketing budgets based on these recurring cycles, and the approach reduces volatility when compared with strategies that treat Super Bowl traffic as an isolated spike. Academic papers published in gambling studies journals have begun incorporating these operational datasets, allowing for more precise modeling of long-term user behavior across product categories.
Conclusion
Evidence compiled from regulatory filings, traffic analytics, and operator reports demonstrates measurable connections between Super Bowl betting volumes and sustained casino site activity throughout the year. Those relationships inform resource allocation decisions and product development cycles while highlighting the value of unified platforms that capture interest across verticals. Continued monitoring through 2026 and beyond will refine these models as new data emerges from expanding markets.